Many companies have a clear goal in mind when dealing with statistics. Quotas allow you to see a visual representation of that goal and how close you are at any given time. You can enter quotas with your values and then choose to view them on your graphs.
To enter quotas, select "single stat entry" under "enter values".

Select the stat that you would like to enter quotas for from the dropdown box and the values will appear.

To enter values for the quota, simply fill in the boxes under "new quota" by the dates you wish to meet these quotas. When you have finished entering the quotas, you can select "save" to just save these new values or select "save and graph" to save these new values and then view your stats and newly entered quotas on a graph.


As you can see, the quota values I have entered appear on the graph. The dotted line displays between entered values so you can see at a glance the targeted value for each week. The graph has been automatically re-scaled to display the highest and lowest quotas during this time period.
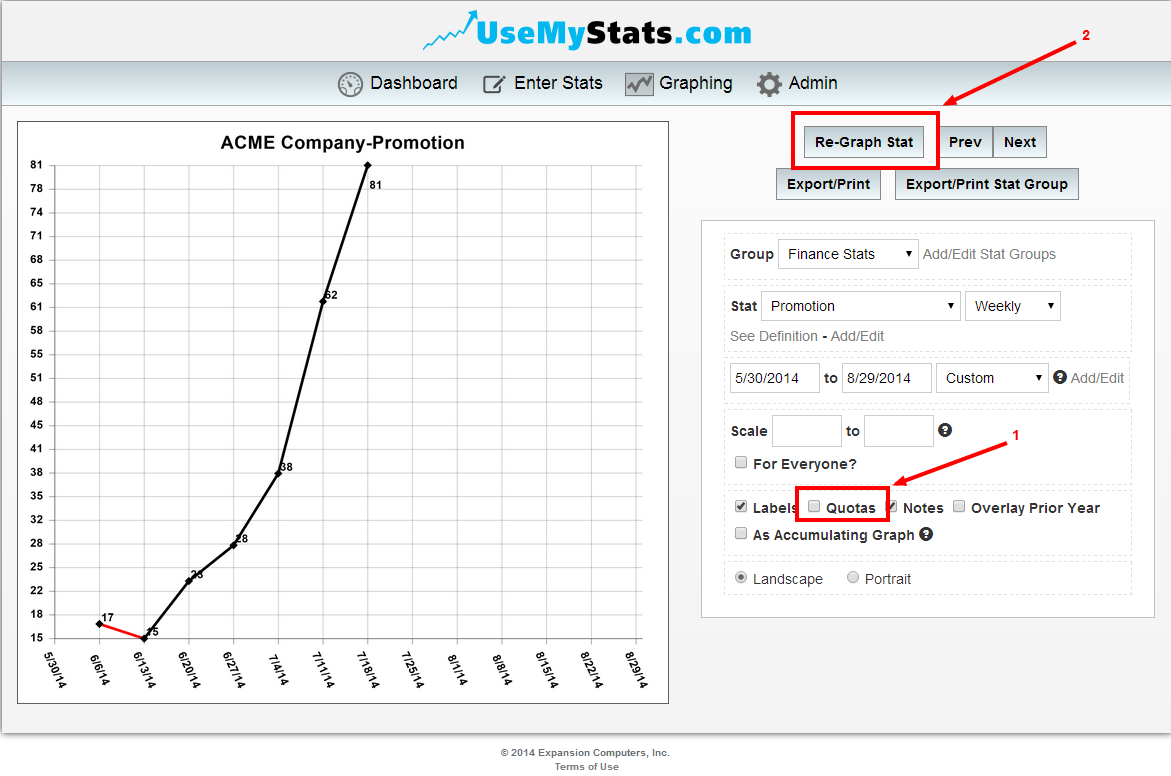
To view the graph without the quotas displayed, toggle the "Quotas" option to say "off" and then click "Re-Graph Stat". The graph will automatically re-scale and display without the quotas shown.
If you happen to enter a quota for the wrong day, here is how to fix it:
That's just a quick overview of how quotas work. Take some time to play around with quotas on your statistics!